What is Technical Analysis?
Technical analysis is a form of studying the market based on the data it’s churning out every second. Technical analysis is the careful examination of market data such as price movements and volumes. In this data, technical traders, so-called technicians, are looking to find patterns and formations that can be used to potentially predict the asset’s next move.
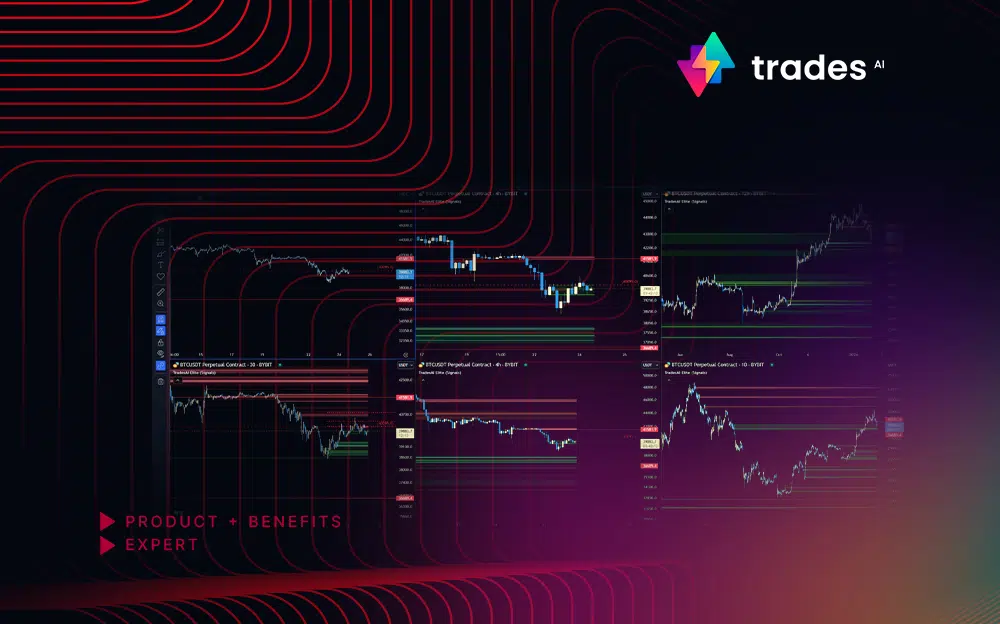
In other words, technical analysis is chart reading. By analyzing charts, with the help of indicators such as our own TradesAI tools, you can anticipate potential price fluctuations and bet on them in advance in order to profit when the move unfolds.
Let’s dig a bit deeper into the technical analysis field and introduce some of the most basic concepts. In this article we'll cover:
- Key Concepts in Technical Analysis
- Tools of Technical Analysis
- Practical Applications of Technical Analysis
Key Concepts in Technical Analysis
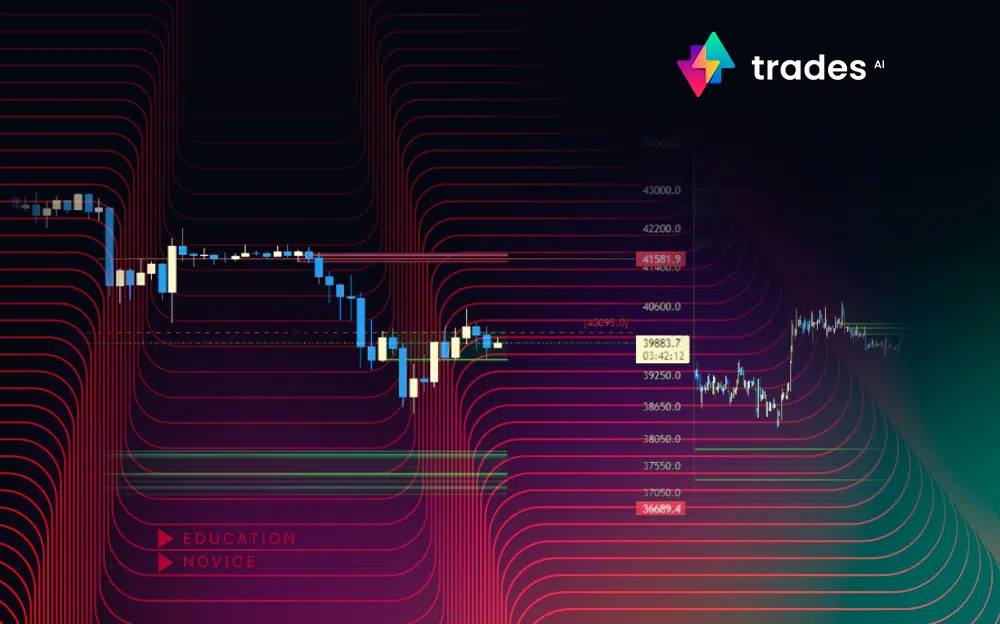
Support and Resistance
Support and resistance lines are a key aspect of trading guided by technical analysis. Let’s see what they mean and how you can use them.
The support line is where the dominant trend meets a previous bottom. And the resistance line is where the same trend meets a previous high. The trend between these two lines could be expected to stay in its current range as buyers and sellers navigate through the motions.
Correctly identifying tops and bottoms, also called inflection points, could serve as entry and exit points to your trades.
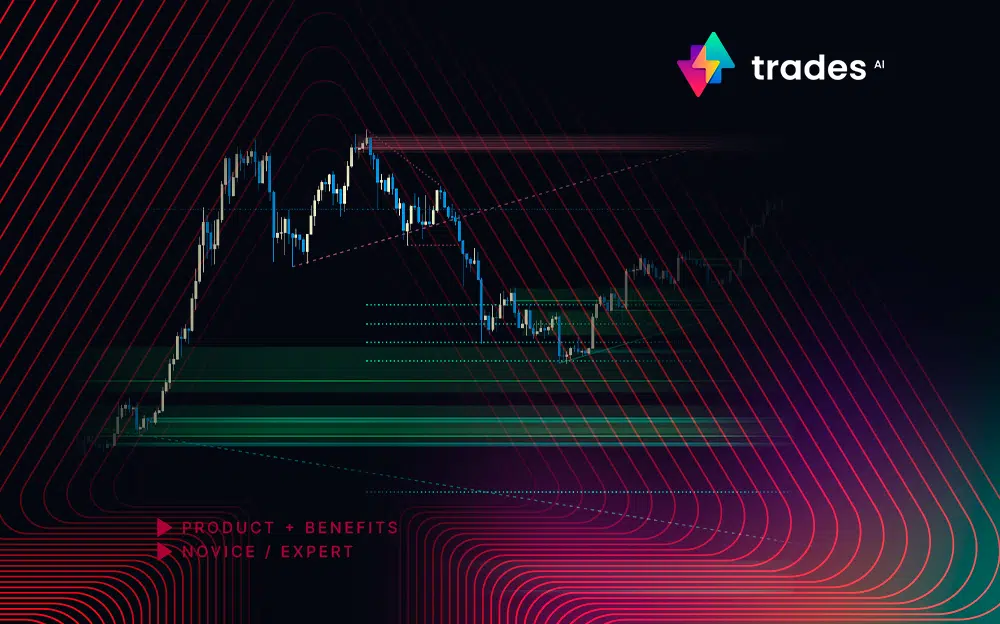
Trend Analysis
Trends serve as the backbone of technical analysis, guiding traders in identifying the prevailing direction of an asset’s price movement. Trends can be classified as uptrends, downtrends, or sideways trends (also known as ranges). Recognizing the trend allows traders to align their strategies with the broader market direction.
There are various strategies you can undertake with a trend. For example, you can be a trend follower – a popular choice for many long-term and short-term traders. Or you can be a contrarian – anticipate the point of reversal and bet against the trend. If you turn our right, you will be among the first to ride the next price wave. In any case, keep in mind the old market adage “The trend is your friend.”
Tools of Technical Analysis
Charts
Charts serve as visual representations of price movements over a specific period. The most commonly used chart types include line charts, bar charts, and candlestick charts. Candlestick charts, in particular, provide valuable insights into price action, depicting opening, closing, high, and low prices for a given period.
By analyzing a candlestick chart, traders can quickly discern patterns such as engulfing patterns, doji, or hammer candles, which offer clues about potential market reversals or continuations.
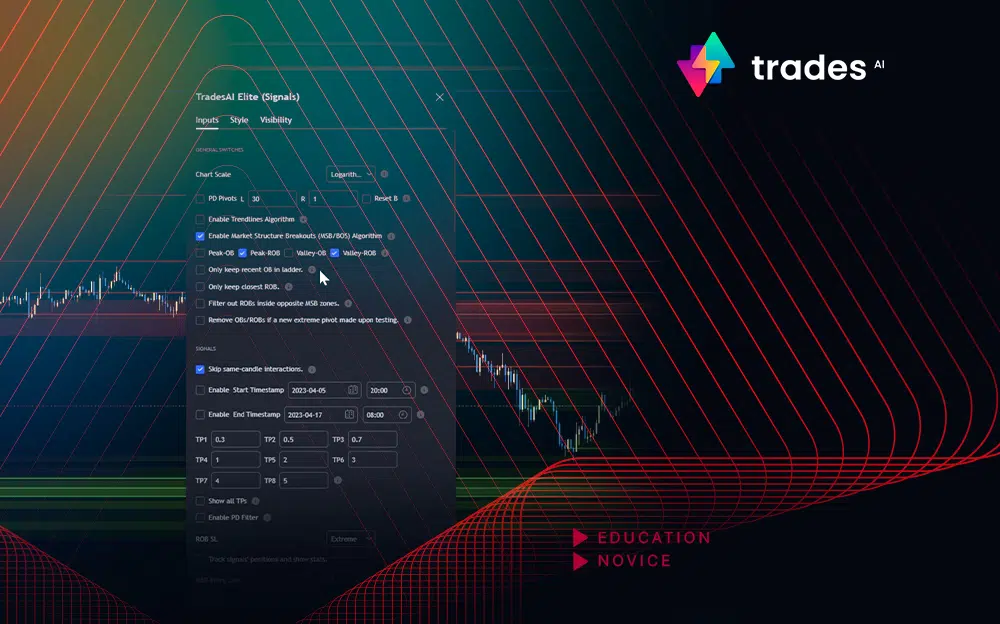
Technical Indicators
These mathematical calculations derived from price and volume data help traders gauge market momentum, volatility, and trend strength. Popular indicators include moving averages, Relative Strength Index (RSI), MACD (Moving Average Convergence Divergence), Bollinger Bands, and, of course, of own revolutionary TradesAI indicator.
Practical Applications of Technical Analysis
Entry and Exit Strategies
Technical analysis provides traders with entry and exit points based on identified patterns and indicators. Whether it’s breakout strategies, trend-following approaches, or reversal patterns, technical analysis helps traders make timely decisions to enter or exit positions.
A trader might utilize a breakout strategy by entering a long position when a stock's price breaches a significant resistance level with high volume, signaling potential upward momentum.
Risk Management
Technical analysis aids in devising risk management strategies by setting stop-loss orders, determining position sizes, and assessing risk-reward ratios. By incorporating risk management principles, traders can mitigate losses and protect capital in volatile market conditions.
Setting a stop-loss order, for example, slightly below a key support level can limit potential losses if a trade moves against expectations. That way, you preserve your capital and minimize downside risk.
Summary
In conclusion, technical analysis serves as a valuable tool for traders to navigate the dynamic landscape of financial markets. By understanding key concepts, utilizing analytical tools, and implementing sound strategies, investors can gain a deeper insight into market dynamics and make trading decisions with a higher probability of success.
While technical analysis isn't without its limitations, its systematic approach to analyzing price movements remains indispensable for traders seeking to gain an edge in the competitive world of investing.